Varietal disease resistance is an important factor when choosing which varieties to grow and then managing these crops in the field.
Disease ratings are given on a scale from 1 (least resistant) to 9 (most resistant). The system is straightforward to understand but it is important to remember that behind the numbers there is a great deal of research to ensure the ratings are an accurate reflection of the crop varieties.
The Recommended List disease ratings are calculated using 3‐5 years data from untreated UK trials. For diseases where there is a very large data set such as Septoria tritici, or where there is the potential for changes in pathogen race, such as rusts, data from 3 seasons are used. For other diseases five years’ data are used.
Indeed, the 2014/15 RL winter wheat Septoria tritici ratings were calculated using data from
89 trials with natural infection from 2011 to 2013.
Within the Recommended List programme disease resistance data is collected from three
different types of trials:
- Untreated – replicated untreated trials
- Disease observation plots – single replicate untreated trials
- Inoculated trials – replicated
Of these the inoculated trials are particularly important as there is high disease pressure which brings out the differences between varieties. The other two types of trial rely on natural infection so the amount of information they give is highly dependent on the season. In addition, inoculated trials use pathogens with known characteristics which helps ensure the effects can be ascribed to a particular disease. For rust, inoculated trial isolates are provided by the United Kingdom Pathogen Virulence Survey (UKCPVS) to ensure that isolates used are representative of current UK populations.
Recommended List trials submit disease data to HGCA in July. After receipt, data are checked and only data from trials in which disease reaches 5% are included in the dataset. This is because disease ratings should highlight the differences between varieties and at less than 5% disease varietal differences are not clear. However, this data can still be used for other research purposes.
Validated disease data for the current season are added to data collected in previous years to create a dataset from which disease ratings are made. First of all, an over‐years mean of disease severity is calculated for each disease in each variety. Next the varieties with the highest and lowest disease severity are used to set fixed points from which to compare other varieties. See the figure at the end of the document for more information.
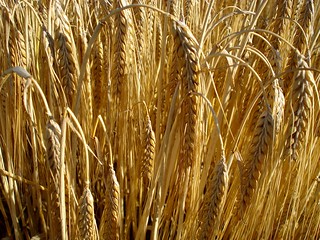
| Barley (Photo credit: net_efekt) |
Selecting the varieties used to calculate high and low disease fixed points is a crucial step as it is this relationship that determines the ratings. For this reason only varieties that have been on the RL for several years and have well established ratings or varieties which have been added to trials as disease controls are used. In addition, a variety with very high levels of disease may not be selected if its inclusion would skew the calculated ratings for other varieties. For most diseases a low disease fixed point of 9 = 0% disease is used to ensure that an RL rating of 9 reflects resistance.
For diseases where both natural and inoculated data are available, separate disease ratings are calculated from each data set which are then combined to give an overall disease rating with a greater emphasis placed on the rating calculated from inoculated data. Careful checks are made to compare new disease ratings with those from the previous year to ensure that there is a good relationship for established varieties unless there is evidence for a change in disease races.
During the rating process there are areas where subjectivity may arise: from assessment of disease in the field, to validation of data, to the setting of high and low disease set points. This concern is mitigated by providing trial managers with recognised visual disease assessment keys as part of the trials protocol to ensure consistency between trials. For data analysis we work closely with the pathology team at NIAB who review and provide support to HGCA when making decisions on data validation and rating calculations.
Disease ratings presented in the current 2014/15 Recommended Lists can be used to help guide varietal choices in the coming season; however, it is important to note that these ratings are calculated from 2009‐2013 trial data and not the current season. Therefore, it is necessary to monitor all crops for disease, even those with a high disease rating, as resistance can develop rapidly.
More information on disease control in wheat, barley and oilseed rape is available in the Crop Management section at hgca.com.
Figure: Calculation of RL disease ratings for individual varieties (●) based on the relationship between high and low disease set points (◆) for Septoria tritici (A) and mildew (B) in winter wheat. Mean disease severity is calculated from 3‐5 years’ untreated trial data. High and low set points are calculated from the mean disease severity of established RL or disease control varieties and their previous disease rating. A variety with very high disease may not be used in setting the high disease fixed point if its inclusion would skew the newly calculated rating for other varieties when compared to previous ratings. To ensure that a disease rating of 9 reflects resistance a low disease set point of 9=0% disease is often used. Once calculated ratings are rounded to the nearest whole number for example a rating calculated at 5.5 is rounded to 6.
The Global Miller
This blog is maintained by The Global Miller staff and is supported by the magazine GFMT which is published by Perendale Publishers Limited.


No comments:
Post a Comment